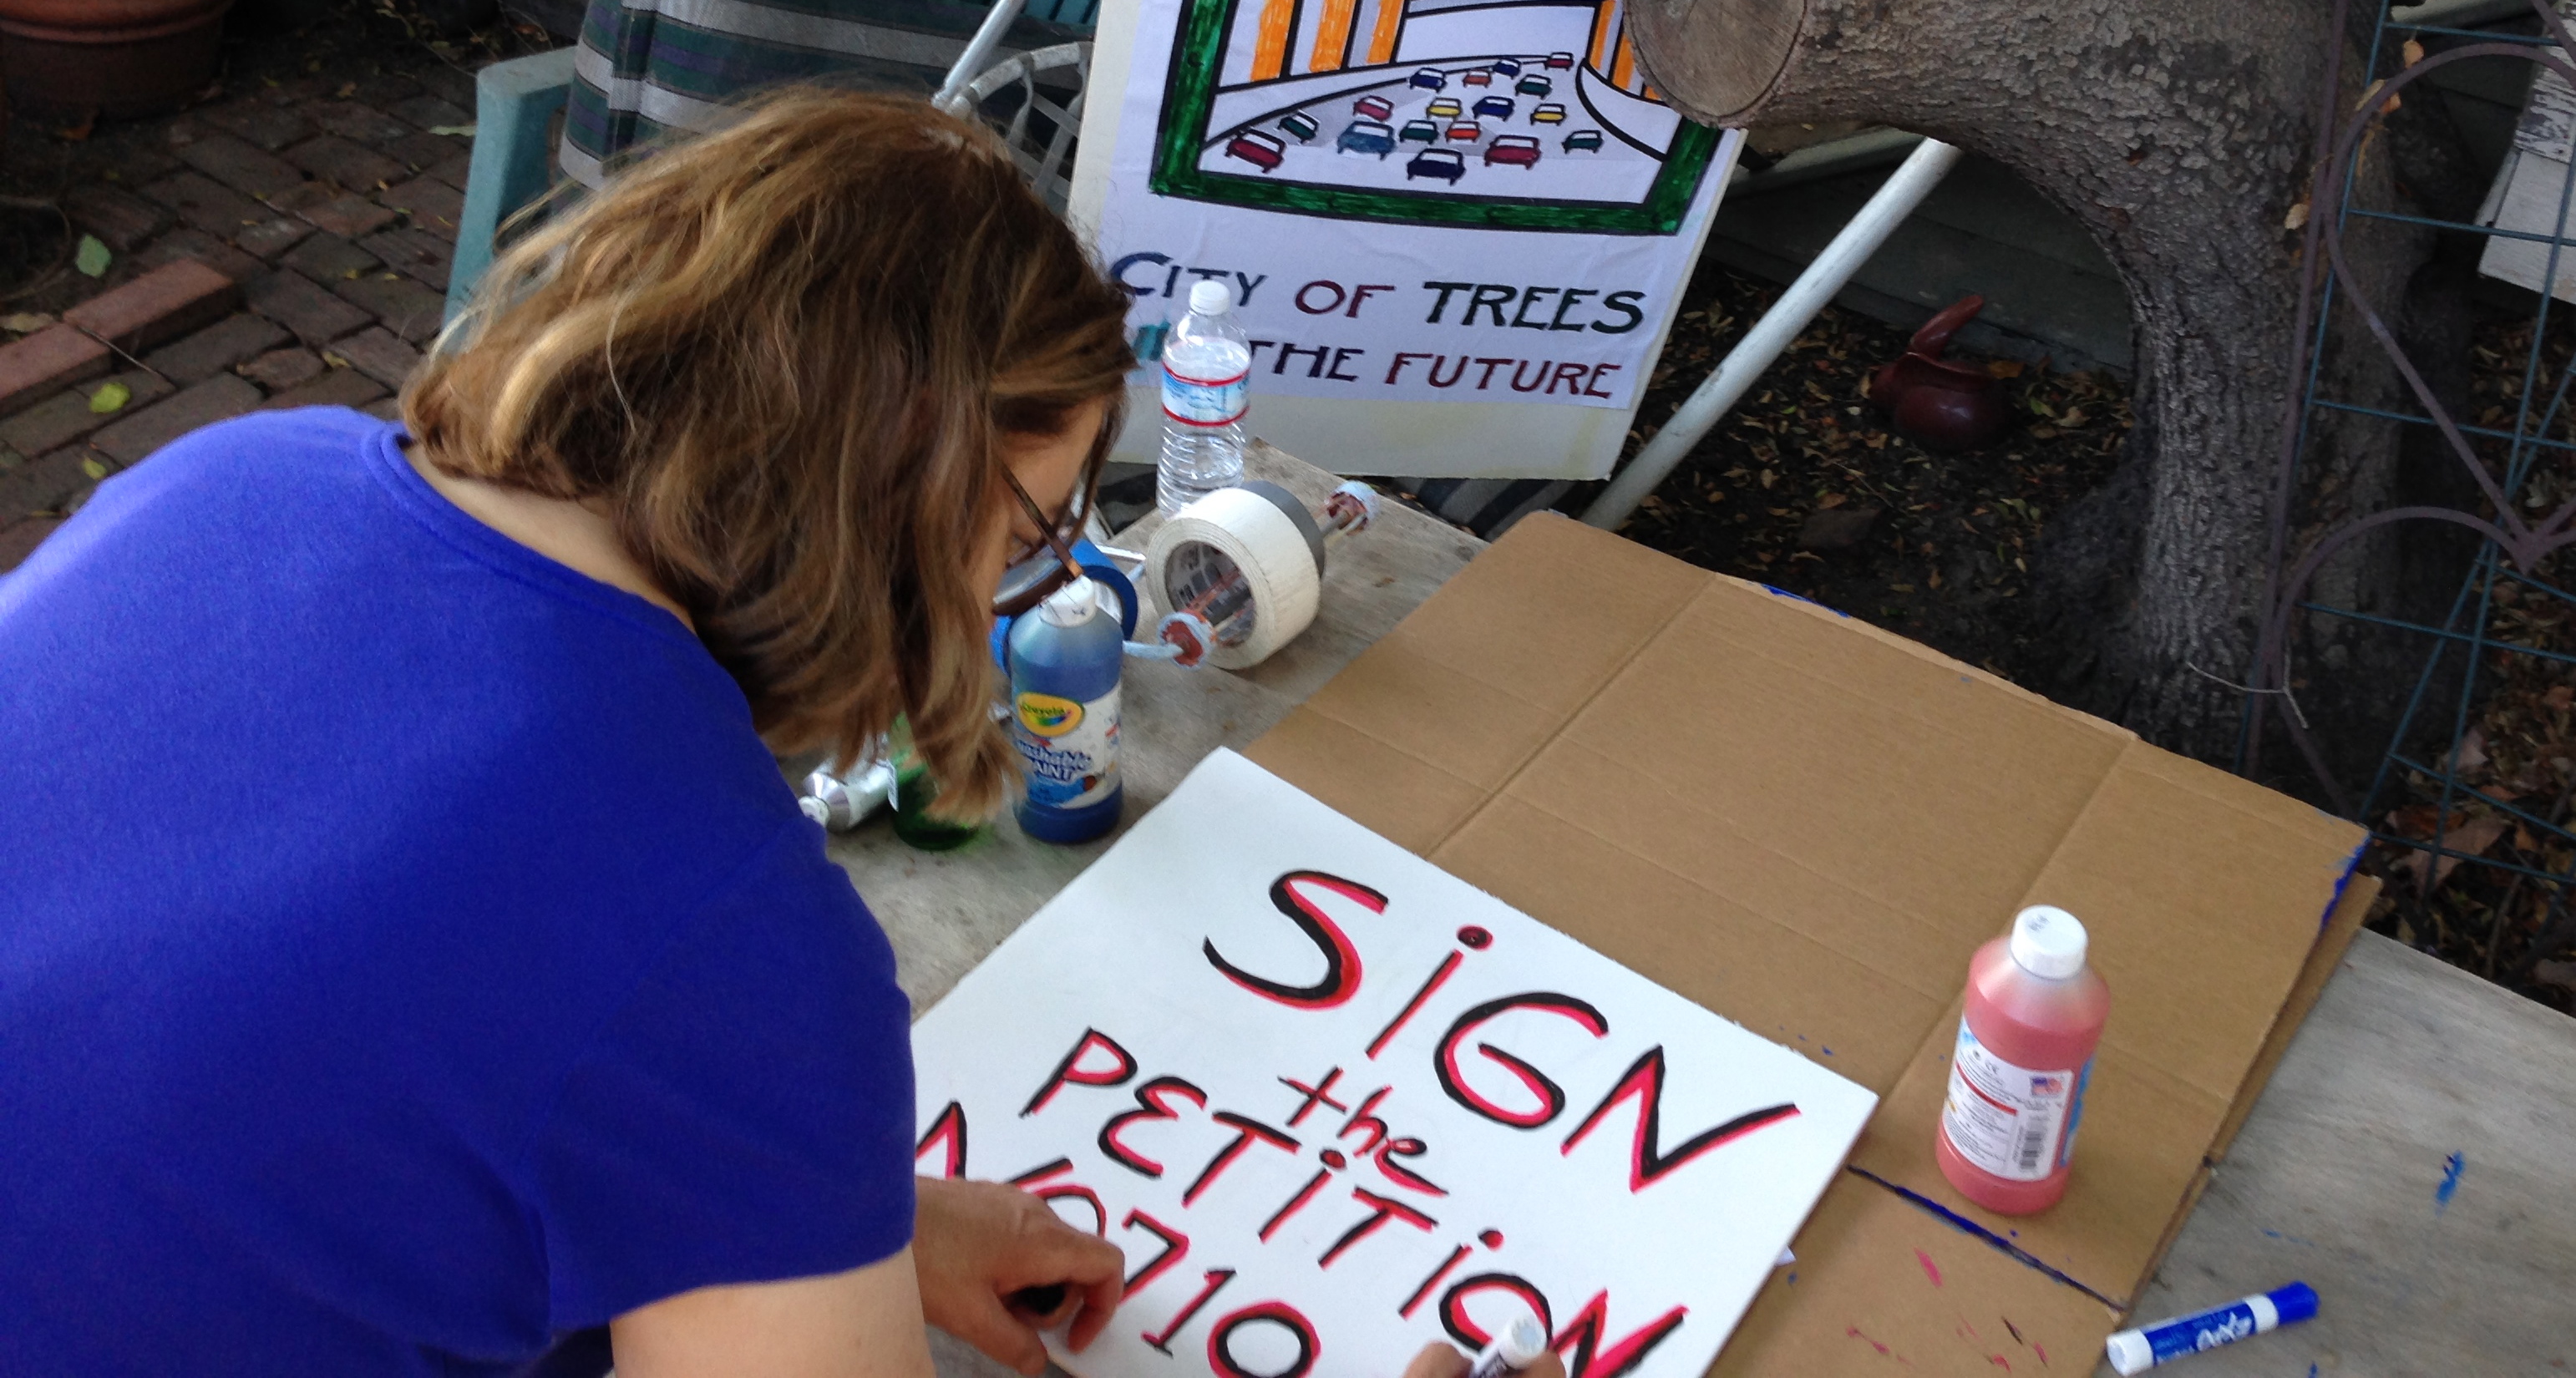
Alhambra traffic on Valley going east from City Council sponsored Close the Gap July 10, 2014 event
The argument that local Alhambra street- traffic will be alleviated does not hold water looking at Metro’s own statistics.
At the Technical Advisory Committee meeting on February 13, 2013, Metro’s consultants (CH2MHIll) reported the results of their Origin and Destination studies (see slides 30 and 31 of their presentation). In terms of Alhambra traffic, only 23% of northbound traffic that travels from northbound 710 onto Fremont is through-traffic trying to get up to Pasadena and would potentially use the tunnel (if they wanted to pay the toll charges); similarly, only 21% of the traffic that enters the southbound 710 from southbound Fremont originates from around the 210/134 interchange in Pasadena and uses the southbound 710 fwy. In other words, more than 3/4 of the traffic will remain on arterial streets and not use the tunnel at all. This is also corroborated in the Alhambra_traffic_flow_map 2015 that shows how the north-bound traffic from the 10 freeway dissipates the further north it goes. Factor in the tolls and those on freeways will be exiting the freeway to avoid the 710 toll tunnel (“diversion rate”) and end up on Alhambra’s streets. Read about “Induced Demand” Duranton – Turner – Road Congestion and the article “What’s Up With That: Building Bigger Roads Actually Makes Traffic Worse” .
What is curious is that some Alhambra City Councilmembers insist the tunnel will help Alhambra, ignoring the Nov. 2012 Alhambra City Council meeting, where they were told similar figures by Hasan Ikhrata, the Executive Director of the Southern California Association of Governments (SCAG) and Doug Failing, then-head of Highway Programs at Metro.
What does the 2015 EIR say? Almost no one benefits, but for those who do, they will save 2.5 minutes:
Table 4-9 (conduct a “find” search so you can find it easily) says that in 2035, 13.7% of arterial traffic is “cut-through,” including those motorists driving between adjacent cities. The tunnel alternatives reduce this cut-through share to 7.3%-10.6%. A small reduction for $5.5 billion! Reducing this cut-through traffic means that 7-13% of all motorists throughout the study area will receive a travel time savings of 2.5 minutes or better – mostly just the motorists using the tunnel itself to travel significant distances – as long as they don’t mind paying the toll. In other words, 87-95% of motorists will get no significant travel time savings, or their travel time will be worse.
4.4.2 Highway Performance by Alternative
Table 4-9 shows the highway system performance measures for each alternative. The table presents the horizon year daily forecasts for the volume crossing an east-west screenline through the study area on arterials and freeways, the daily VMT on arterials, the percentage of trips on arterials making long-distance trips, and the percentage of trips in the peak periods that are saving more than 2.5 minutes as compared to the No Build Alternative.
Freeway traffic doesn’t get better: It shifts around and gets worse in the immediate area.
Compare figures 5-8/5-9 with figures 5-22/5-23, and any of the other tunnel options. These demonstrate that we don’t solve any congestion problem with the tunnel. With the tunnel, congestion on most freeways stays about the same. HOWEVER: what gets significantly worse is the 210 between the 710 to into Glendale and the 2 fwy, and also the 710 south of the 10 as before the tunnel portal. The tunnel would only shift some traffic off the 605 and onto the 710. The only benefits are slight reductions in congestion on the 605 just south of the 210.
Arterial traffic congestion actually gets worse in Alhambra and Rosemead and better in South Pasadena.
Compare figures 5-5/5-6 with 5-28-31. Note that arterial LOS in the No Build is exactly the same as existing conditions.
Now compare arterial intersection congestion in the tunnel options to the No Build. The tunnel options make arterial congestion worse in Alhambra, particularly on Valley and Fremont. The Alhambra problems seem to be due to the fact that trips to Alhambra from the north would all get concentrated at the Valley Blvd. ramps rather than filtering through the grid as they do now. The chart shows that, if anything, some of the few arterial intersection benefits are in South Pasadena.
Sign the petition: Remove the Tunnel Alternative in Favor of Better Alternatives